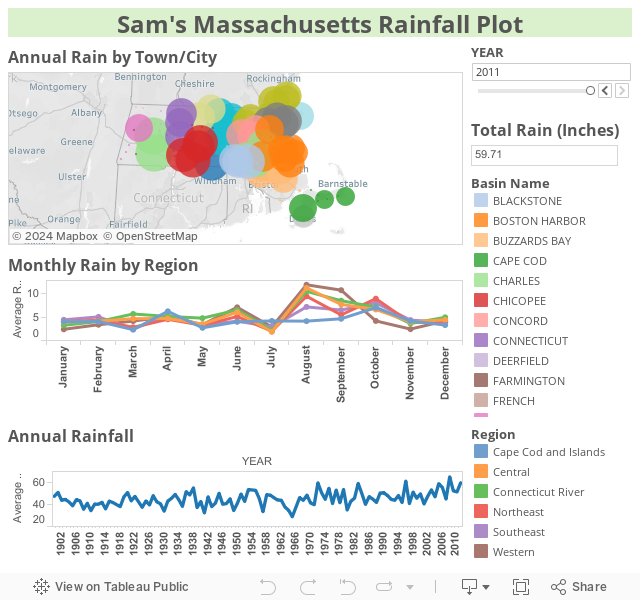
I’ve been learning a bit about data visualization tools lately, and last night I decided to go digging through Massachusetts government websites to see if there was any interesting data I could plot. I didn’t expect to spend my night learning about the history of rainfall in the state, but the Massachusetts precipitation database turned about to be a great resource. Below is what I came up with in half an hour or so.
On the map, each color represents a water basin — essentially where the water for the town or city comes from. The size of the circle represents the total rainfall in the area in a given year. You can toggle between years on the right. In any given year, I charted the monthly rainfall by region below the map. And finally, at the very bottom is a chart of overall annual rainfall in the state by year from 1902-2011. Click any year on the bottom chart, and the top two will update as well. To clear that selection, click anywhere else in the chart. For any meteorologists visiting my site for the first time, welcome! And anyone who knows of other public datasets that would lend themselves nicely to visualizations, feel free to leave a note in the comments.